The Russian invasion of Ukraine in February 2022 triggered one of the sharpest geopolitical realignments in the recent history of trade. The European Union, historically dependent on Russian energy, committed to eliminating this critical vulnerability. Three years later, updated trade data provide an opportunity to assess whether political commitments have translated into an economic reality.
EU trade with Russia
EU imports from Russia have fallen by 91%, from €20.5 billion per month to €1.7 billion, in constant prices. The decline is explained by a sharp drop after the invasion between March 2022 and 2023, followed by a sustained reduction. EU exports to Russia have also decreased, though less, by 75%: from €7.1 billion per month to €1.8 billion, in constant prices.
“The sharp reduction of EU-Russia trade has been a collective effort. Between 2022 and 2025, all Member States reduced their imports from Russia”
The trajectory of exports has been more volatile and, significantly, has remained virtually flat over the last year (from December 2024 to December 2025), while imports have continued to fall (Figure 1). Taken together, EU-Russia trade links have been drastically reduced. In 2022, Russia was the EU’s fifth-largest trading partner, behind the United States, the United Kingdom, China, and Switzerland. However, by 2025, Russia had fallen to 19th.
Figure 1. EU imports and exports with Russia (January 2022 to December 2025, constant prices).
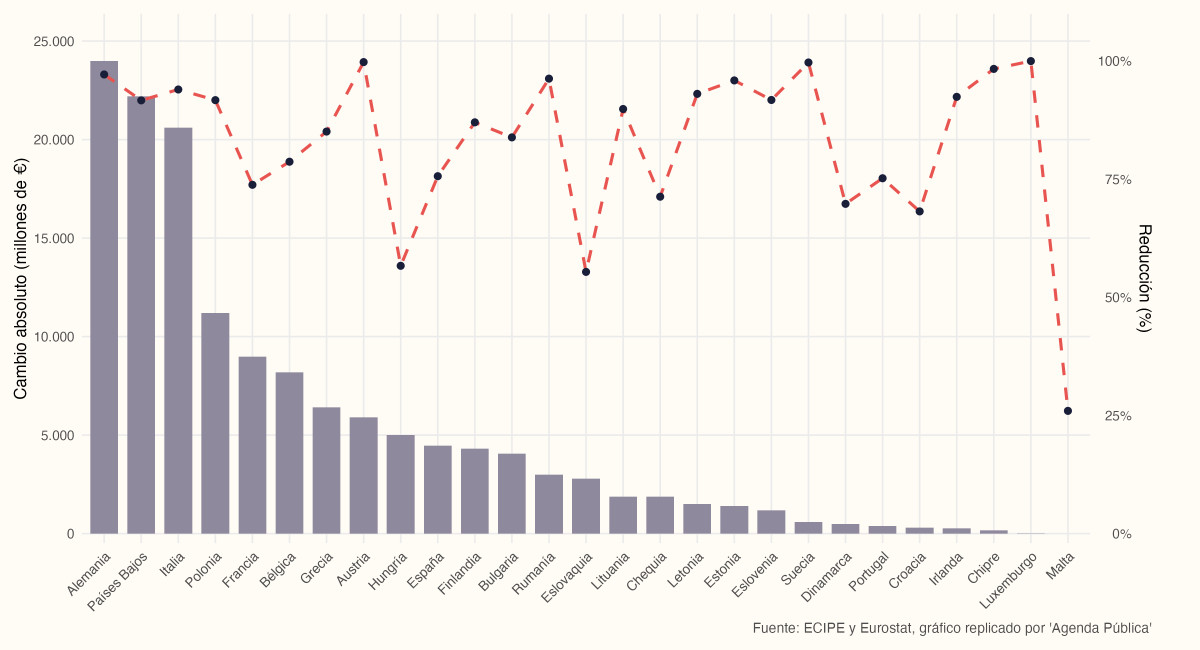
The sharp reduction in EU-Russia trade has been a collective effort. Between 2022 and 2025, all Member States reduced their imports from Russia. However, the scale and speed varied notably (Figure 2). In absolute terms, the largest economies bore most of the adjustment. Germany, the Netherlands, Italy, Poland, and France concentrated the bulk of the reduction.
“The drop in Germany’s imports amounts to 97%, reflecting how deeply Russian goods, especially energy, were integrated into its supply chains”
In relative terms, however, the smaller economies recorded the largest proportional declines: Luxembourg cut imports by 100%, Cyprus by 98%, and Romania by 96%. Germany stands out for meeting both conditions. Its reduction of €24.0 billion in imports represents a 97% drop, underscoring how deeply Russian goods, especially energy, were embedded in its supply chains. Not all Member States moved at the same pace. Malta, Slovakia, and Hungary recorded the smallest reductions: 26%, 55%, and 57%, respectively.
Figure 2. Change in EU Member States’ imports from Russia (2022-2025, EUR millions)
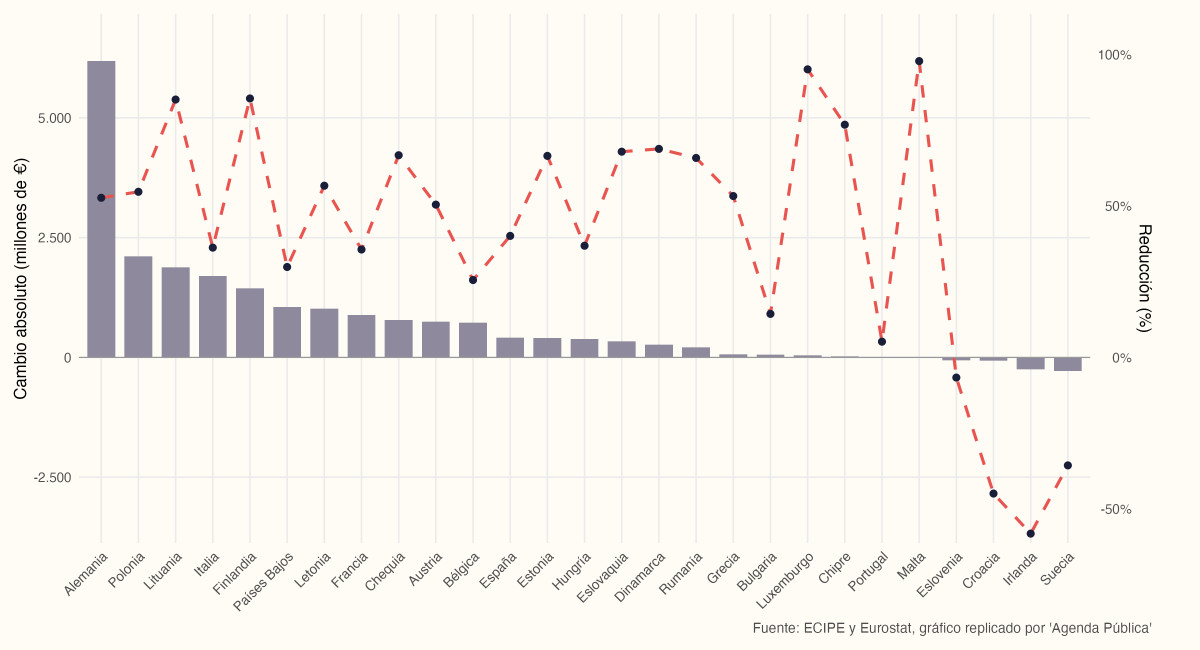
The export panorama is more complex. While most Member States reduced their shipments to Russia between 2022 and 2025, a small group (Slovenia, Croatia, Ireland, and Sweden) recorded slight increases (Figure 3). Germany again leads in absolute terms, with a cut of €6.2 billion, more than three times Poland’s reduction (€2.1 billion), the second-largest. Finland and Lithuania also achieved sizable cuts of 85% each, a notable fact given their previous commercial relationship with Russia.
Figure 3. Change in EU Member States’ exports to Russia (2022-2025, EUR millions)
Sectoral differences
The sectoral breakdown shows where decoupling has been most complete (Figure 4). At one end, the EU has virtually eliminated imports of textiles, plastics, and wood from Russia, with a 99% reduction between 2022 and 2025. Chemicals and various manufactured goods follow, with declines of 94% and 93%, respectively. Taken together, these three sectors accounted for a quarter of EU imports from Russian territory in 2022, so their near-complete withdrawal is economically significant.
The agriculture and beverages sector recorded the smallest decline, though it reaches 72%. Services fell by 78%, suggesting persistent demand for specific capabilities or, alternatively, the difficulty of cutting intangible trade flows. In a middle ground stood minerals and fuels (87%), machinery and vehicles (83%), and stone, glass, and metals (78%): substantial reductions, but far from the near-total withdrawal observed in some manufactured goods.
Figure 4. Percentage decline in EU imports from Russia by sectoral categories (2022-2025)
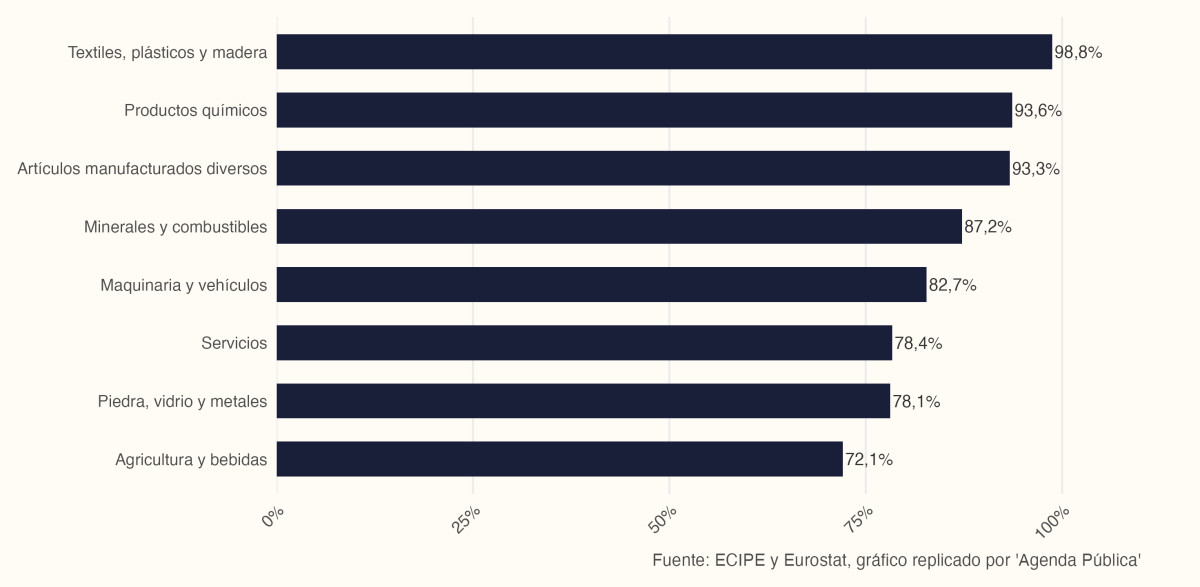
Note: all values are at constant prices. Sector categories were created by aggregating the existing product classifications according to the CPA.
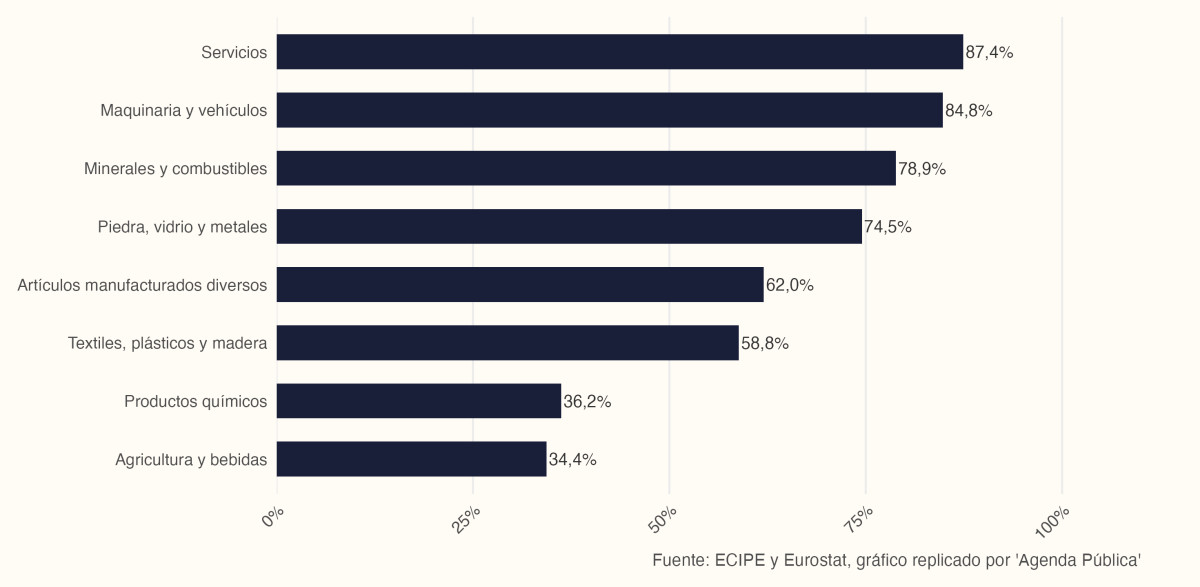
In exports, decoupling has been more partial (Figure 5). Services recorded the most pronounced decline, by 87%, followed by machinery and vehicles (85%), pointing to the impact of export restrictions on high-tech goods and on intangible trade. Minerals and fuels fell by 79%, and stone, glass, and metals by 75%, marking a clear rupture, though far from the near-total withdrawal observed in EU imports.
On the other end, agriculture and beverages declined only 34%, the smallest reduction of any sector and roughly half the downturn in machinery. Diverse manufactured goods (62%), textiles, plastics and wood (59%), and chemical products (36%) were mid-range. No sector exceeded reductions of 90%, in contrast to imports, where three sectors nearly disappeared.
Figure 5. Percentage decline in EU exports to Russia by sectoral categories (2022-2025)
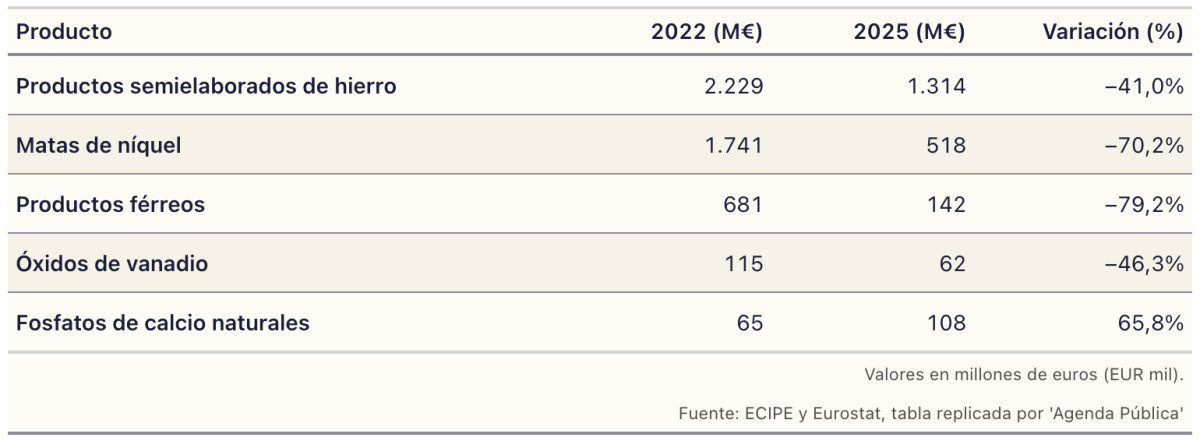
Products with high dependency
An earlier ECIPE article, Russia’s Import Dependency Problem, identified ten product categories in which the EU depended heavily on Russian imports in 2021. Table 1 shows what happened to some of these dependencies between 2022 and 2025. Semi-finished iron products fell from €2,229 million to €1,314 million; nickel mattes, from €1,741 million to €518 million; ferrous products, from €681 million to €142 million; and vanadium oxides, from €115 million to €62 million. Natural calcium phosphates, by contrast, rose from €65 million to €108 million.
Table 1. EU imports from Russia of dependent products (2022 and 2025)
A stabilized decoupling between the capitals and Moscow
Three years after Russia’s large-scale invasion of Ukraine, the economic decoupling between the European Union and Russia has been deep and offers relevant lessons. The data show a clear rupture, with EU imports from Russia falling by 91%, from €20.5 billion per month to €1.7 billion, and exports to Russia dropping by 75%, from €7.1 billion to €1.8 billion (constant prices).
The steepest cuts concentrated in the first 12 to 18 months of the conflict. However, the subsequent stabilization of import and export series since September 2024 suggests that the decoupling process has found a practical floor.
Ultimately, the EU-Russia trade data offer a lesson on the geopolitics of trade. They show that even deeply entrenched economic dependencies, especially in strategic sectors like energy, can be broken within a relatively short period when there is sufficient political will. At the same time, they underline the limits of economic decoupling, by revealing a level of trade interaction that persists even under substantial political pressure.
